I have long been unhappy with the subjective nature of my assessment of students’ class participation. Earlier in my career, I simply equated asking and answering questions with successful participation. I also included trips to office hours. But it was clear I was privileging one kind of student: the kind that is assertive, confident, and verbal.
This changed when I split my classroom into “pods,” work groups of four. Then I was able to hear more voices and see the many ways quiet students contribute to the success of a day’s class.
This year I am trying something new, in order to more thoroughly consider what I value in terms of participation and in-class collaboration. I have had the vital guidance of my colleague, Rob van Nood, who directs a program for improving instruction, especially through technology, called the Educational Lab. With Rob’s help, I have made a simple Google Form to keep track of what I see in my classroom during discussions and collaborative work time. Below is an example of what the screen of my iPad might look like:

It made some of my students a bit nervous to have me standing there, silently tapping on an iPad. So I quickly came to the conclusion that it made sense to record only the positive actions of the students. Of course, if I leave “Ready to Go” blank that means they aren’t prepared to start when class begins.
As you can see from the example below, I make check marks as I move around the room. Once I find myself wanting to mark a box a second time, I submit the list, open another one, and keep going.

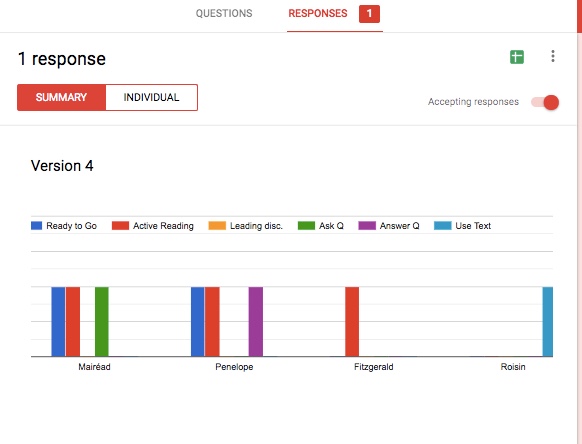
What’s nice is that the form offers me a bar graph to look at. Below is an example for four imaginary students. You can see that Máiréad and Penelope were ready when class began and that only Róisín had not read her homework actively (marking key ideas, etc.). This of course is too small a sample size to be of much use.
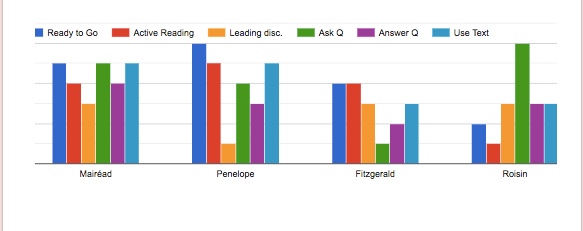
After a few class meetings, patterns begin to emerge. I could point out to Róisín that her active reeding hasn’t been great, but I am happy with the way she is asking her peers questions during group work. I might point out to Penelope that she is coming on time, prepared for class. During our group work she is using her text well to back her points, but I could note that I haven’t been seeing her leading her group very often.
The goal would not be to tell Penelope she is failing to lead, but to give her a snapshot of what I see, talk about what’s going well, and consider what goals she would like to make about her collaborative work.
While standing in the middle of the classroom with my iPad, I have become acutely aware of how little I see. When I face one group of students, I can’t see the other three. In other words, I don’t see most of what happens. So the portrait I am drawing here is highly incomplete.
Still, this regimen ensures that I check their homework (their active reading) and that I note who is prepared to begin on time. And I have noticed that I focus more on quieter students, paying better attention to their engagement, noting their questions and how they respond to the conversation within their group. I am also noticing how quieter students might say something brief that moves the discussion in their group forward, on to the next question perhaps.
When I use the iPad, watching the students interact, I have also been less likely to interrupt my students’ discussions! This is one of my goals!
I will continue to tinker with my categories. I am hopeful that by June the bar graphs will tell a more comprehensive story about each student’s time in class than I would be able to recall as I sit down to write my narrative reports. Surely, this is better than relying on my memory or on the highly subjective notes I would sometimes jot down after class. Such notes usually refer to a single, notable insight or question. With my bar graphs, I hope, I am appreciating more of the day-in-day-out effort that I really hope to see in my students.
